By Sophia Gorman Oriani

Courtesy of D. W. Rowlands
Editor’s note: Last month, we published an article by Nolan Clancy about proposed redistricting in Prince George’s County that would impact the City of College Park. The county council has moved forward with its process; we are bringing you this update describing its decision.
Despite widespread citizen opposition, the Prince George’s County Council voted on Nov. 16 to accept a redistricting map. The map, which divides the City of College Park along new lines, went into effect on Dec. 1.
In January, the county council appointed a redistricting commission to develop a new map. County district boundaries are redrawn every ten years, following the U.S. Census, to ensure that the districts have approximately equal populations. Prince George’s County has nine districts, with one council member elected from each district. Two at-large members are elected, as well.
On Sept. 1, the redistricting commission presented their proposed map to the council. Following a public hearing, county councilmembers then introduced two alternative maps in mid-October. The first of these two alternative maps, which was introduced by Councilmember Derrick Davis (District 6), placed all of College Park, including the university, in District 1. This proposal sparked protests in the City of College Park, and the university also opposed the change. A week later, a second alternative map, proposed by Councilmember Mel Franklin (At-Large), left most of College Park in District 3, but with a long thin finger of District 1 extending south from the Beltway.
Over 150 opponents of Franklin’s map registered to speak at the Nov. 16 county council meeting. Commenters said that the map had been gerrymandered, redrawn to favor some electoral candidates — in this case, those who support unchecked development — over others.
At the meeting, the county council approved Franklin’s map 6 to 3. Dannielle Glaros (District 3) voted against it, as did Thomas Dernoga (District 1) and Jolene Ivey (District 5). The Davis map, and the map proposed by the commission, were shelved.
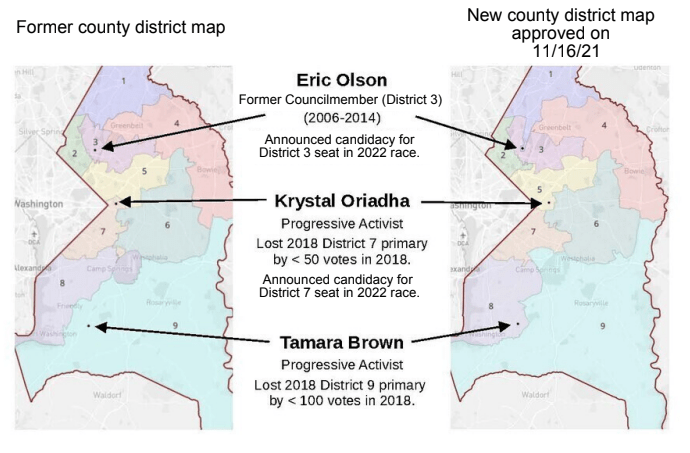
Under the ratified map, the new boundaries directly affect three residents who considered running for the county council. Krystal Oriadha, who lost a 2018 race by fewer than 100 votes, announced her campaign for a District 7 seat, but has withdrawn from the race, as the new map places her residence in District 5. Tamara Brown, who had not announced her candidacy for the District 9 seat, ran in 2018 and, like Oriadha, lost by a narrow margin. The new map places Brown’s residence in District 8.
College Park resident Eric Olson, who had already announced his intention to run for the District 3 seat, was impacted by the redistricting, as well. The new map designates Olson’s home in District 1. Olson, who served on the county council from 2006 to 2014 and has a track record as an environmentalist, said in an email that he is investigating his options. All three candidates identify as politically progressive.
A person must have lived in a district for at least one year before running for office, so the redrawn boundaries make all three candidates ineligible to run for office in summer 2022.
College Park Mayor Patrick Wojahn spoke on behalf of the College Park City Council, which voted unanimously to oppose the Franklin map. “The current proposed map divides College Park right through its center,” he said.
Glaros expressed her disappointment with Franklin’s map and its impacts on the College Park neighborhood. “I deeply question the moral compass of my colleagues,” she said.
Deni Taveras (District 2), who is the county council’s vice chair, defended Franklin’s map on the grounds that the redistricting commission did not have enough time to review census data, as conducting the census was delayed by the pandemic. Taveras said that Franklin’s map, which was developed later, does a better job than the commission’s map of incorporating the census data. “This map does more for black and brown communities than any other map ever submitted,” she said.
According to geographer D. W. Rowlands, though, the ratified map does not significantly change minority representation in District 2. According to Rowlands, the redistricting commission’s map would also draw District 2 as a majority-Latino district. The only metric significantly impacted by the ratified map is the percentage of voting-age Latino residents in the district; that percentage increased from 49.5% to 50.6%, a majority. Being of voting age does not necessarily correlate to being qualified to vote, which depends on status; about half of Latino residents in the district are citizens, and thereby qualify.
For more information on the redistricting map,visit pgccouncil.us/845/Maps.


